
Skip to content

Service C · Visualisation

Data you understand in seconds.

Polls, weather models, geodata, calendars: we turn data that is hard to read into a page with a clear answer – and the reasoning right below. Verified, fast, data-minimal.

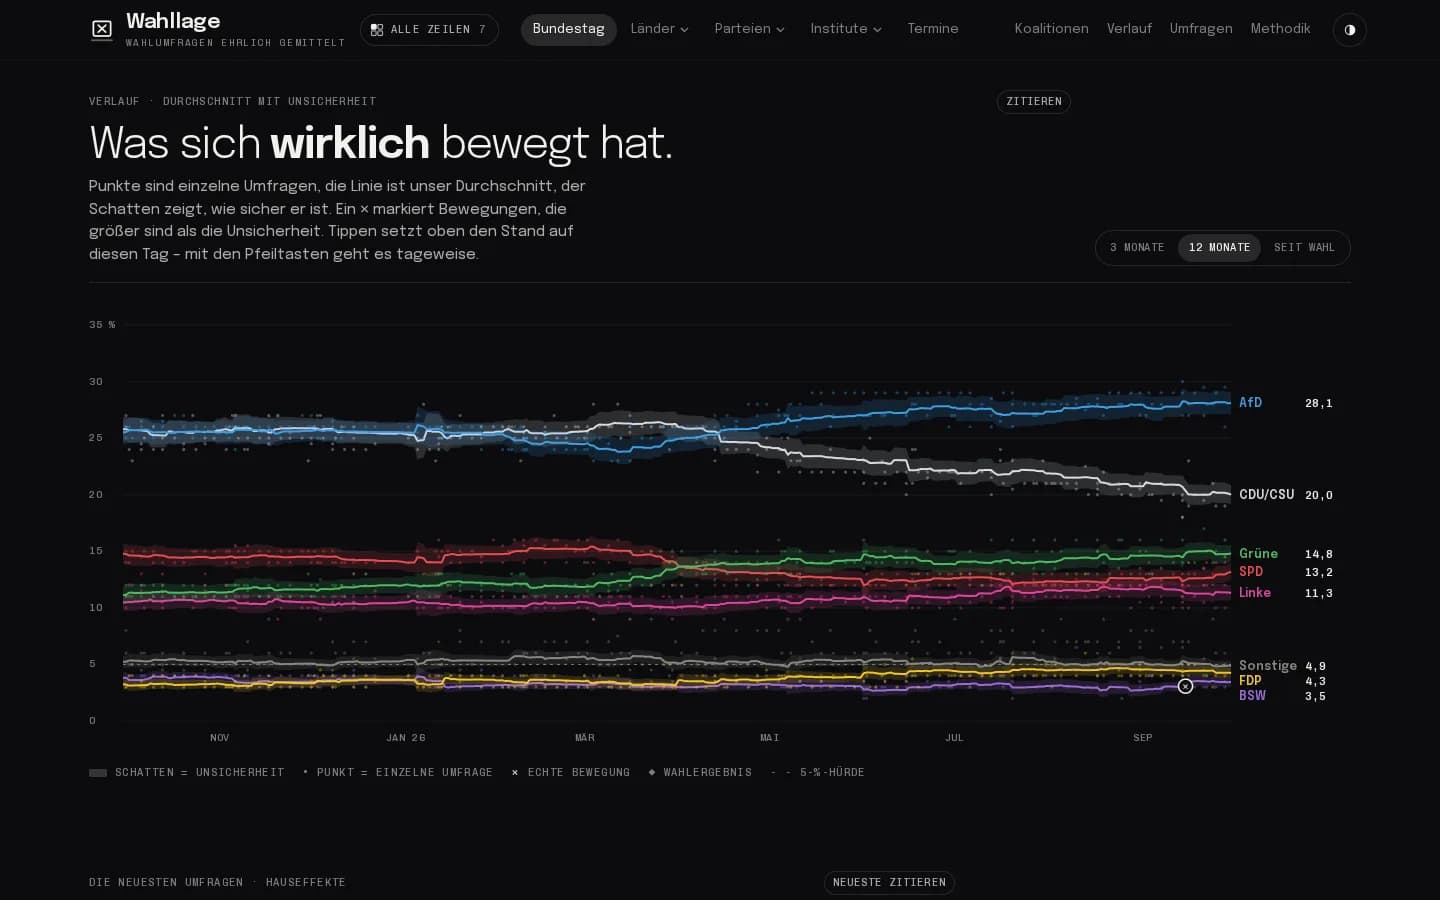
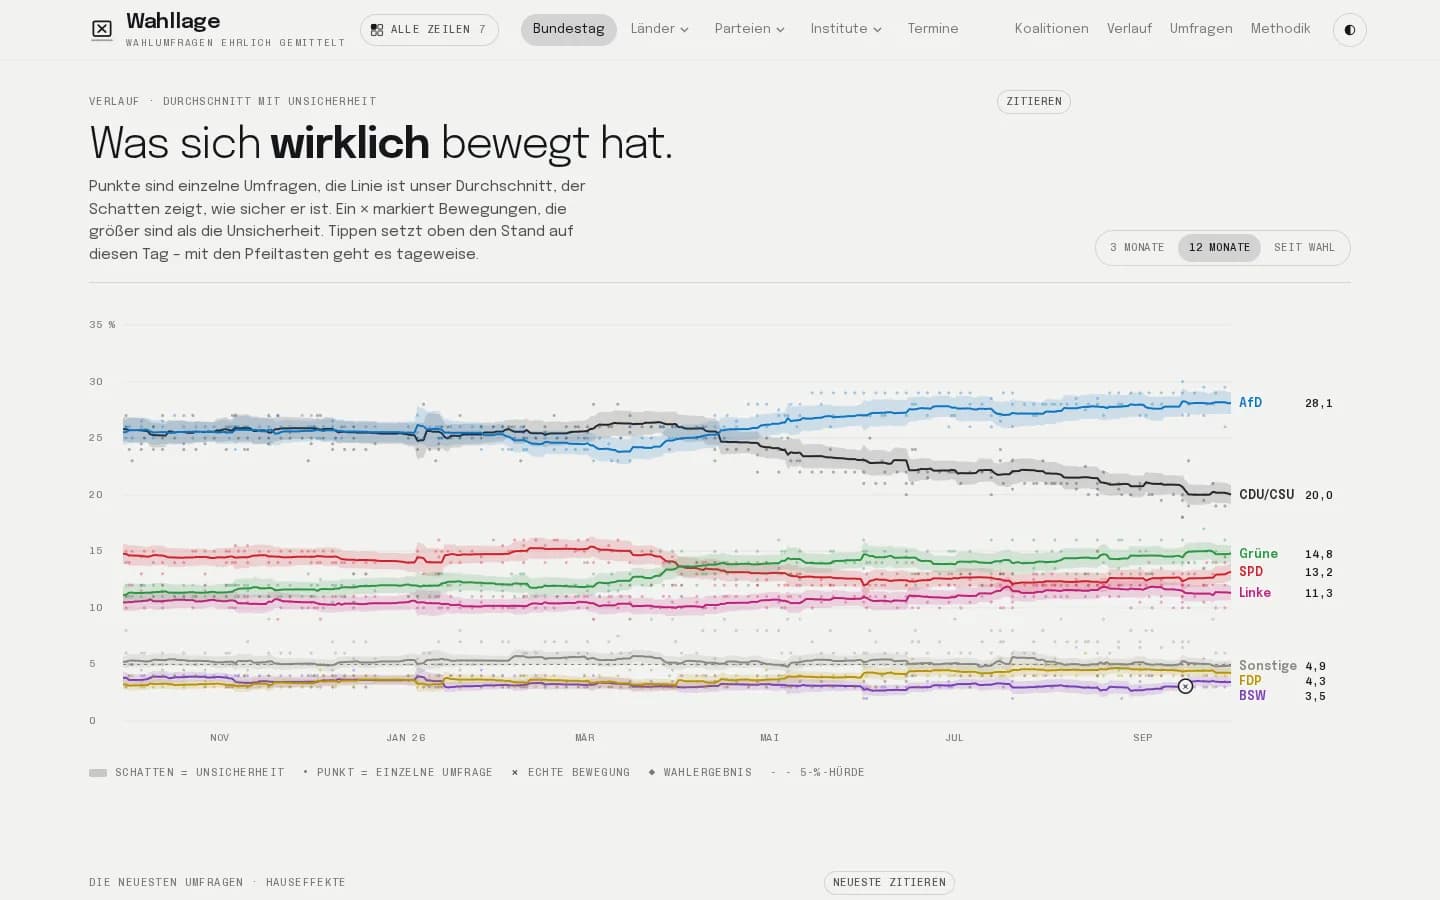
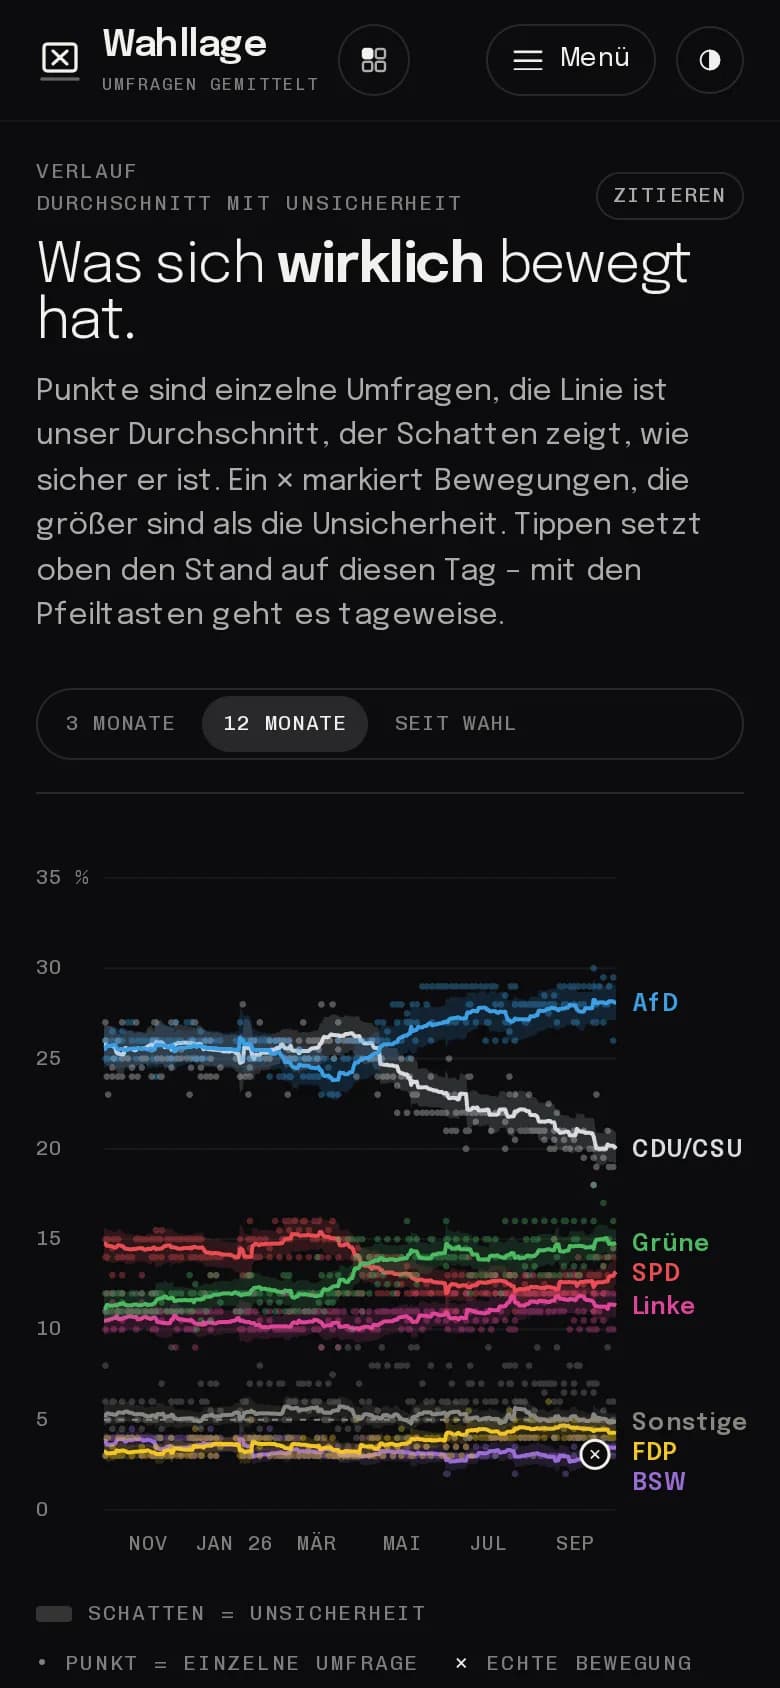
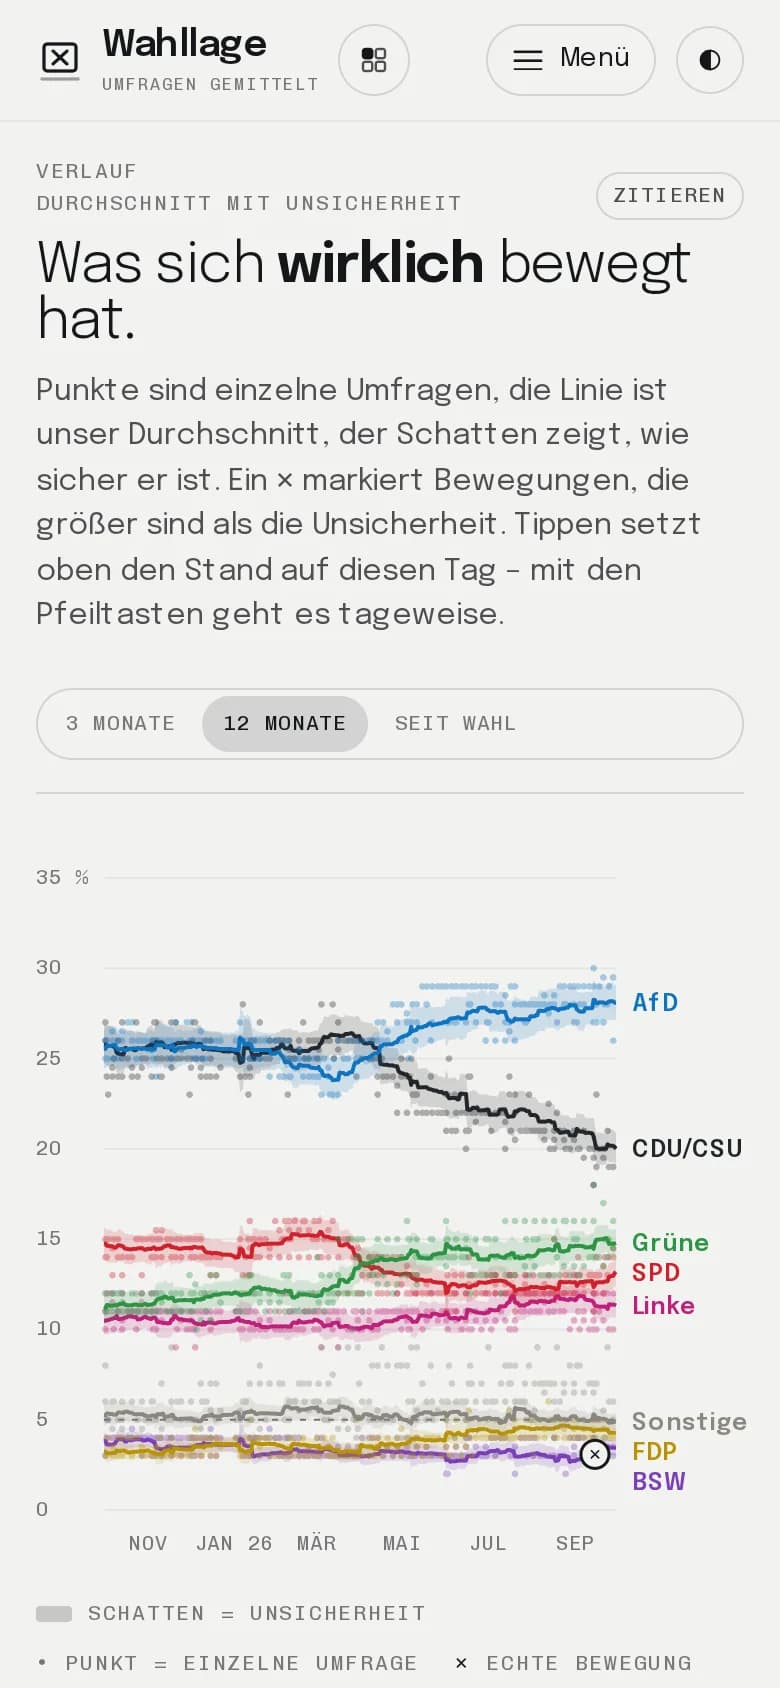
Abb. 01Wahllage – polls honestly averaged, uncertainty visible · own product, live

01Forms

Four ways to show data.

The form follows the question, not the tool. Often it is a combination.

  • 01

    Lines and charts

    Trends with visible uncertainty and one sentence as the answer on top – readable in three seconds.

    Wahllage · Wetterzeile

  • 02

    Maps and WebGIS

    Interactive maps from open and official geodata, with filters, search and location.

    Campingzeile · Himmelszeile

  • 03

    Scrollytelling

    A story that unfolds as you scroll – for reports, campaigns and explainers.

    Mind Atlas

  • 04

    Time as a band

    Calendars, deadlines and dates as one line you can take in at a glance.

    Jahreszeile

02Examples

To click, not just to look at.

All examples are our own products running on real data every day. You get the same care.

All work
  • 17 parliaments · updated daily

    Wahllage

    German election polls, honestly averaged: the average with its uncertainty, pollster house effects, seats and majorities – for the Bundestag and all 16 state parliaments. Our own product.

    • Visualisation
    • Web & software

    Own product
  • 14,420 places · DWD data only

    Wetterzeile

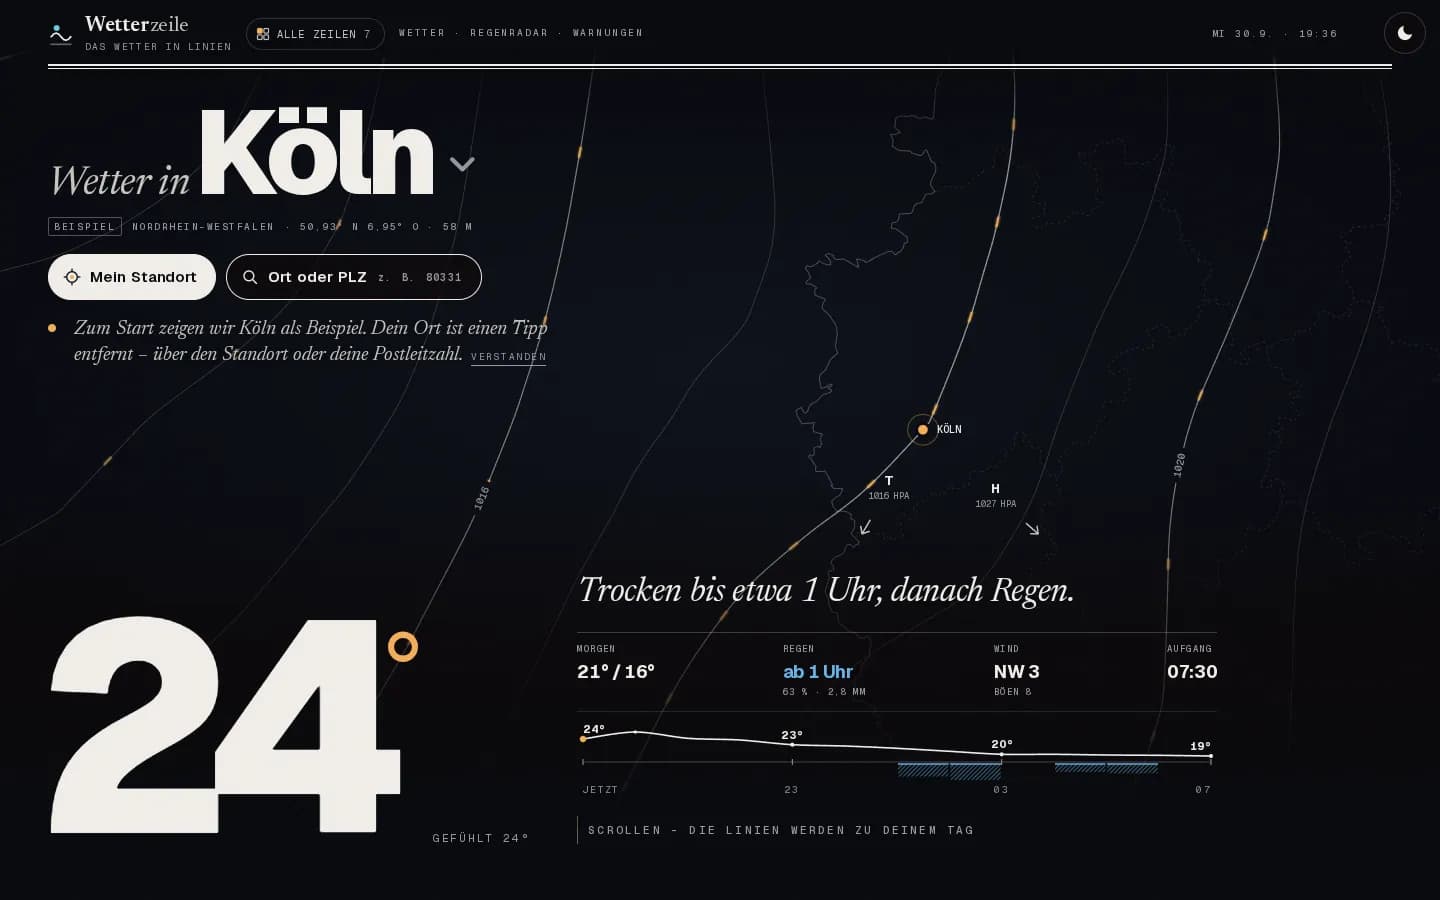
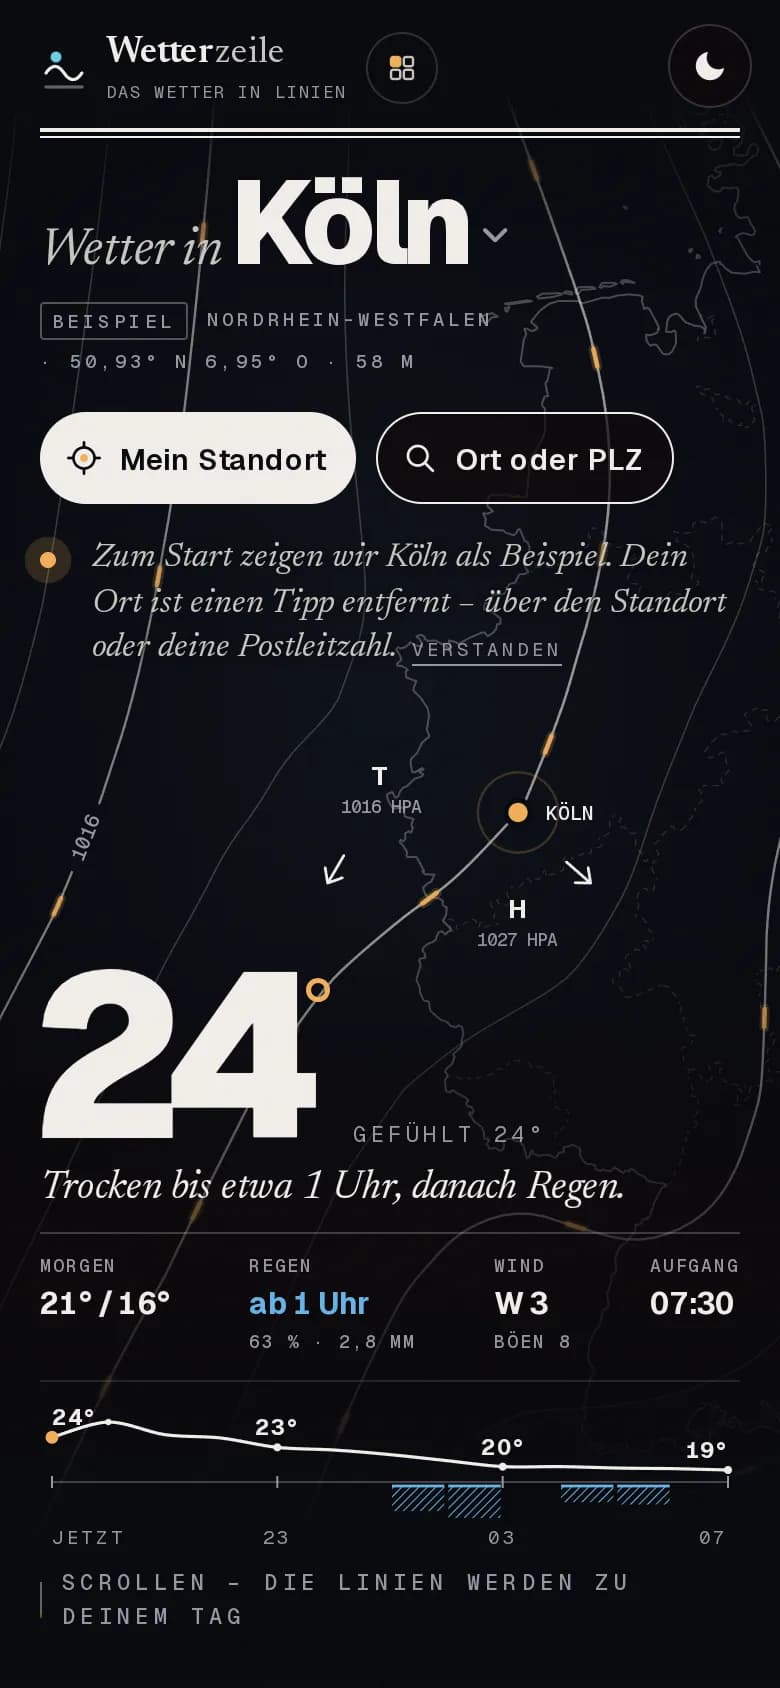
    Weather in lines: rain for the next two hours, an honest forecast with its uncertainty and official warnings for every place in Germany – from the open data of the German Weather Service. Our own product.

    • Visualisation
    • Geodata & remote sensing

    Own product

  • 7,764 sites · open geodata

    Campingzeile

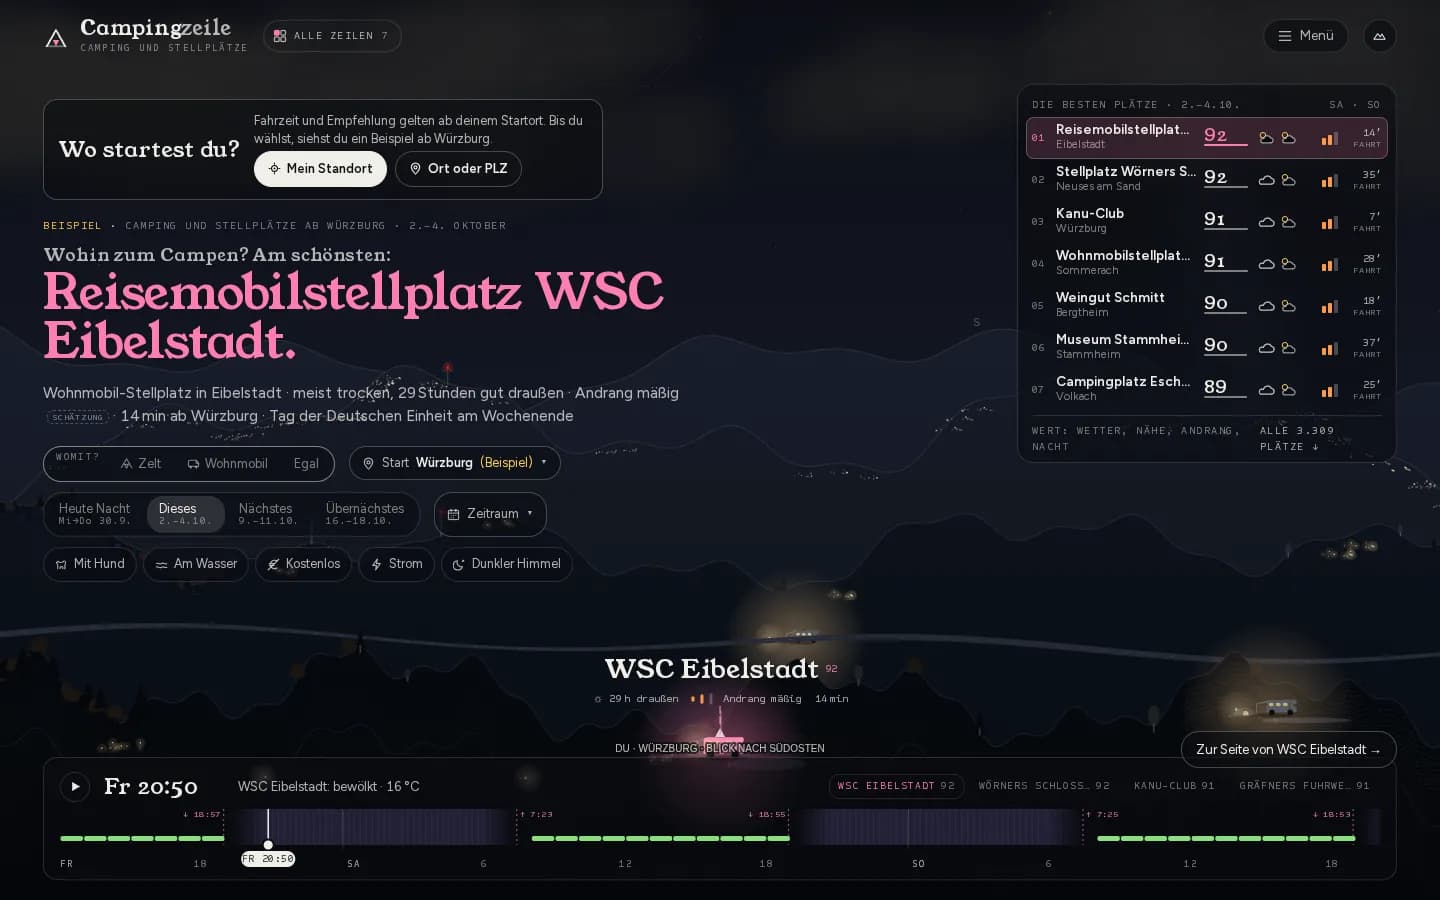
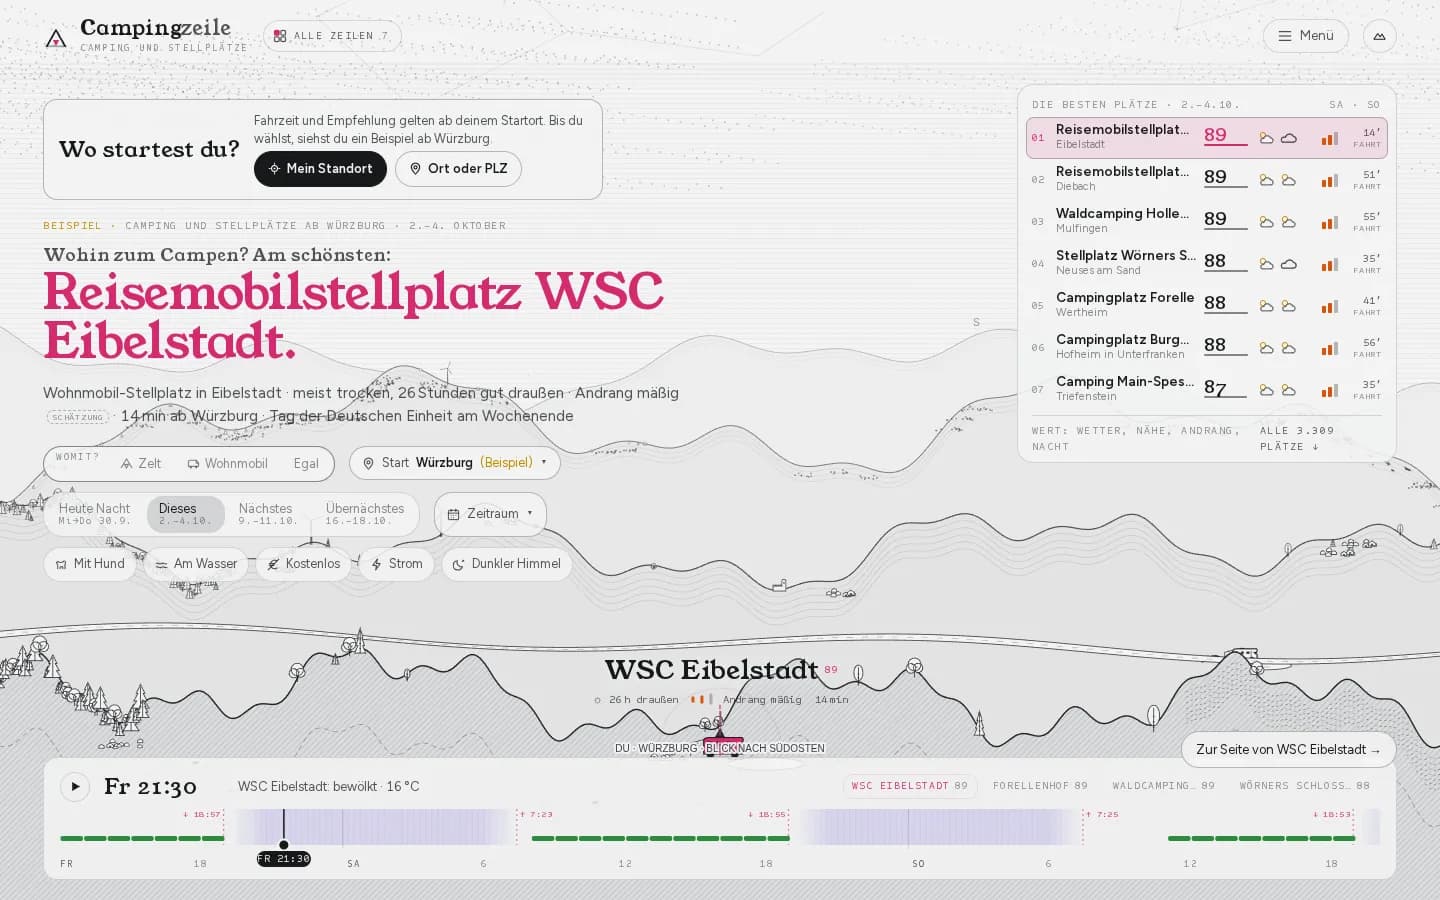
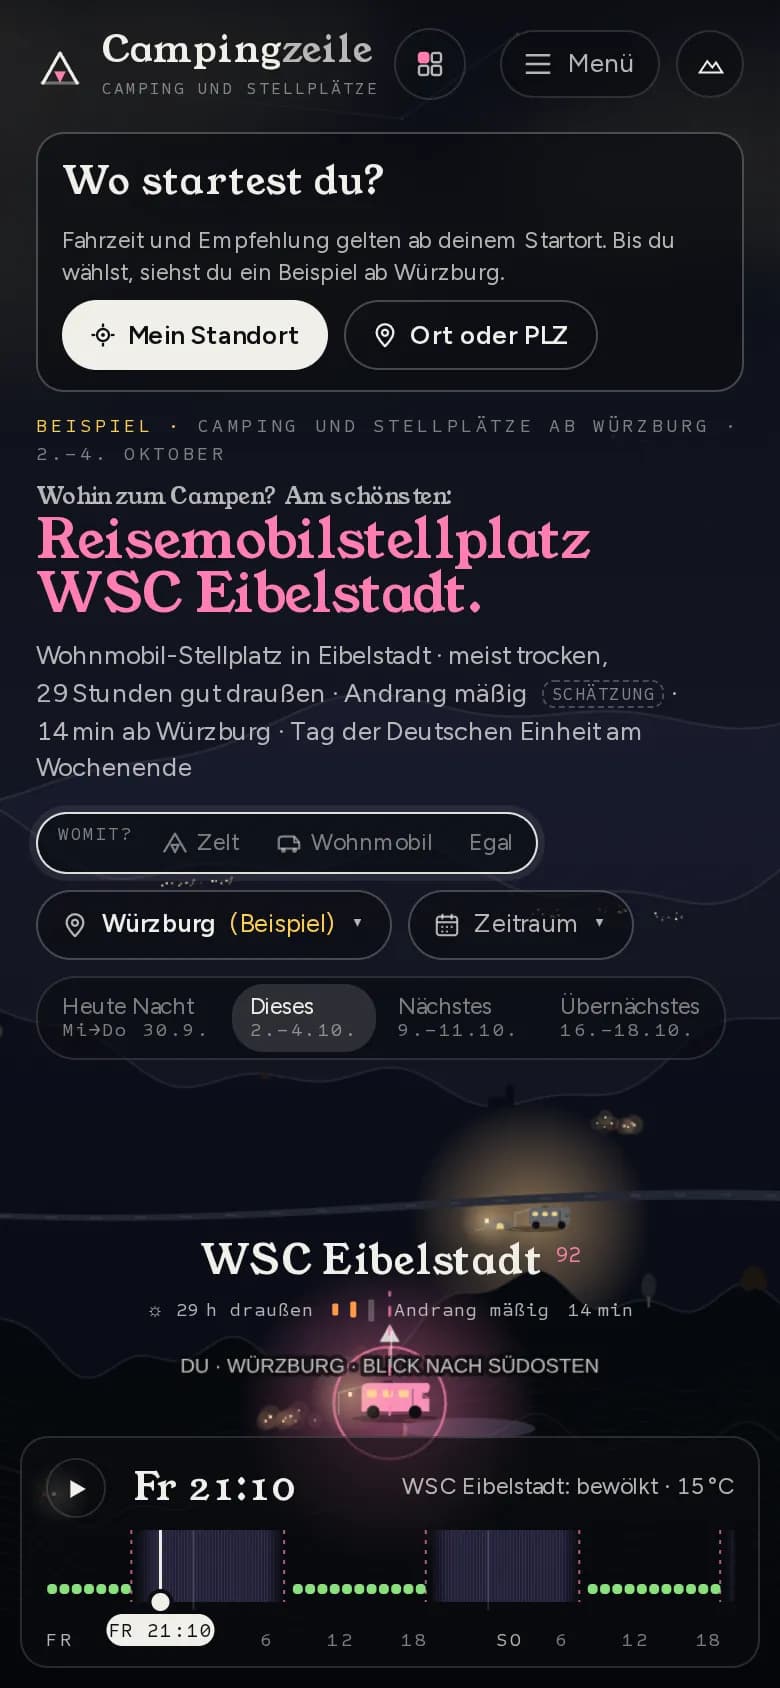
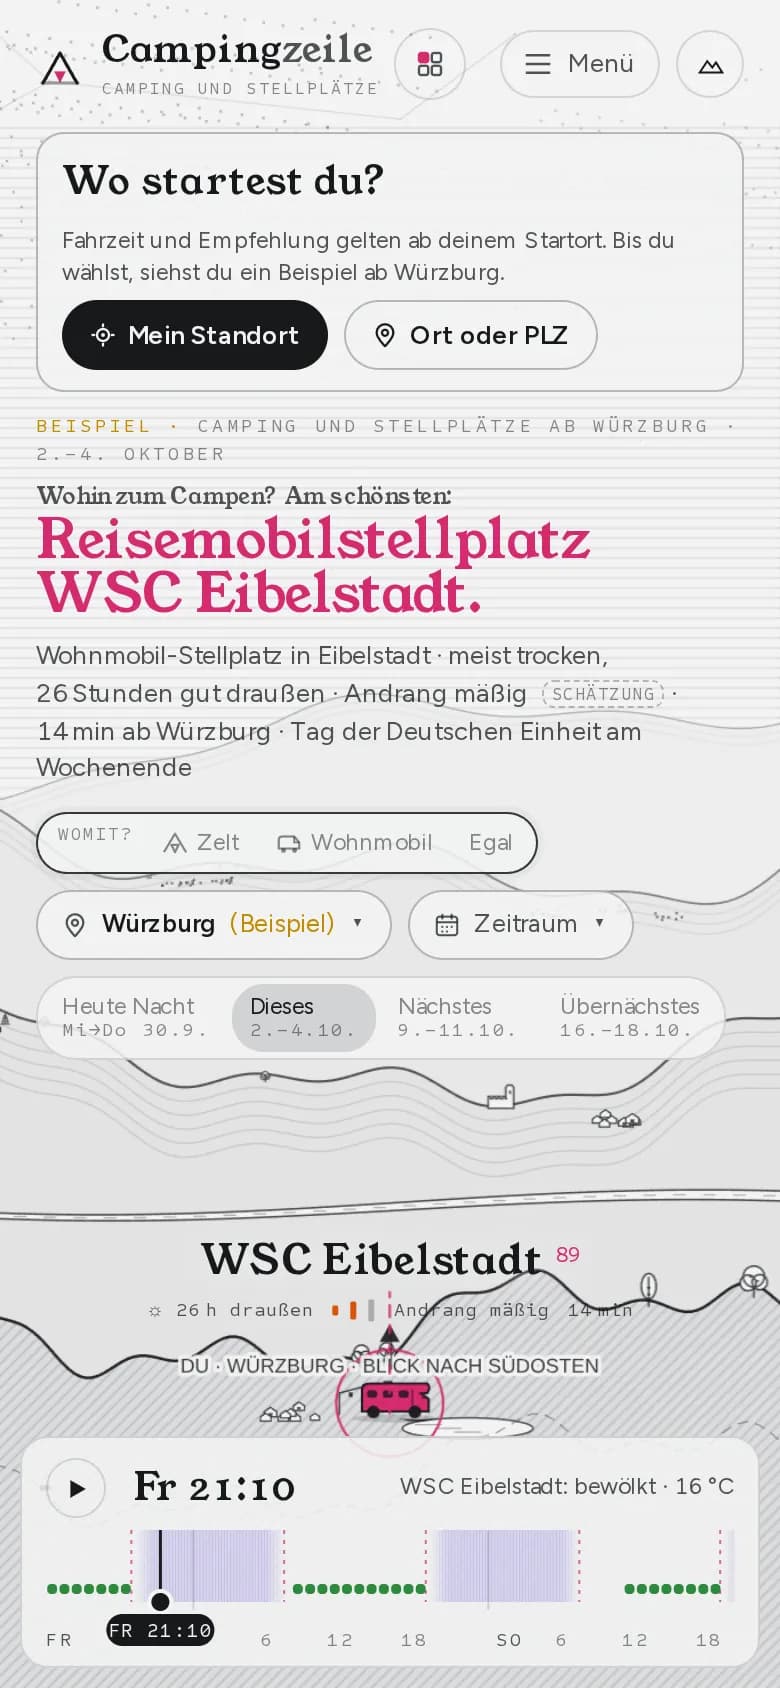
    Where to go camping this weekend? Campsites and motorhome pitches from open geodata, ranked by weather, driving time, crowding and night – with map, bathing sites and water temperature. Our own product (in German).

    • Geodata & remote sensing
    • Web & software

    Own product
  • 2,941 places · explore the sky

    Himmelszeile

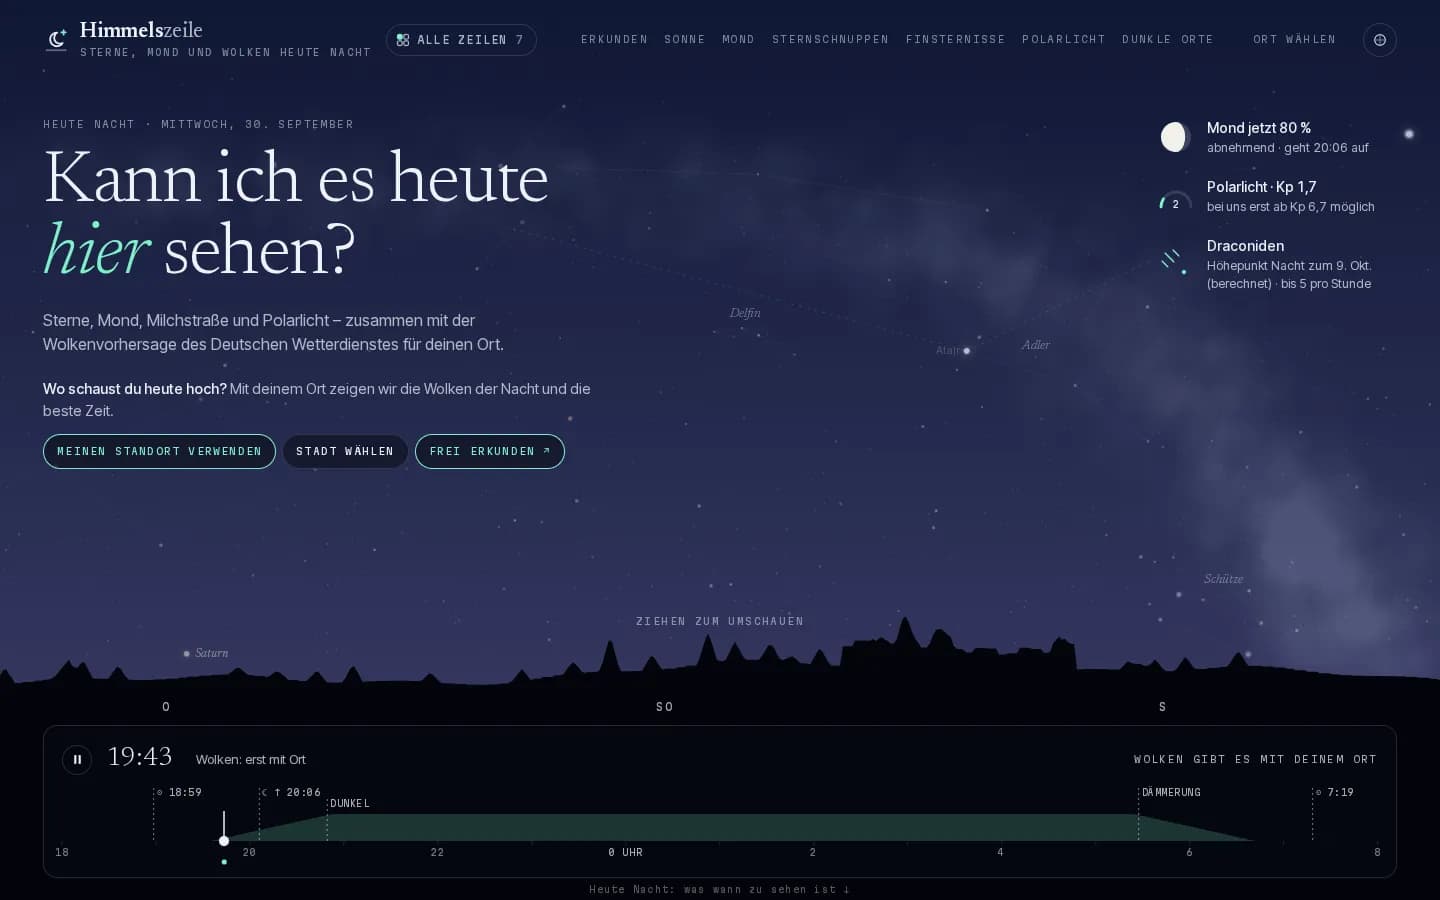
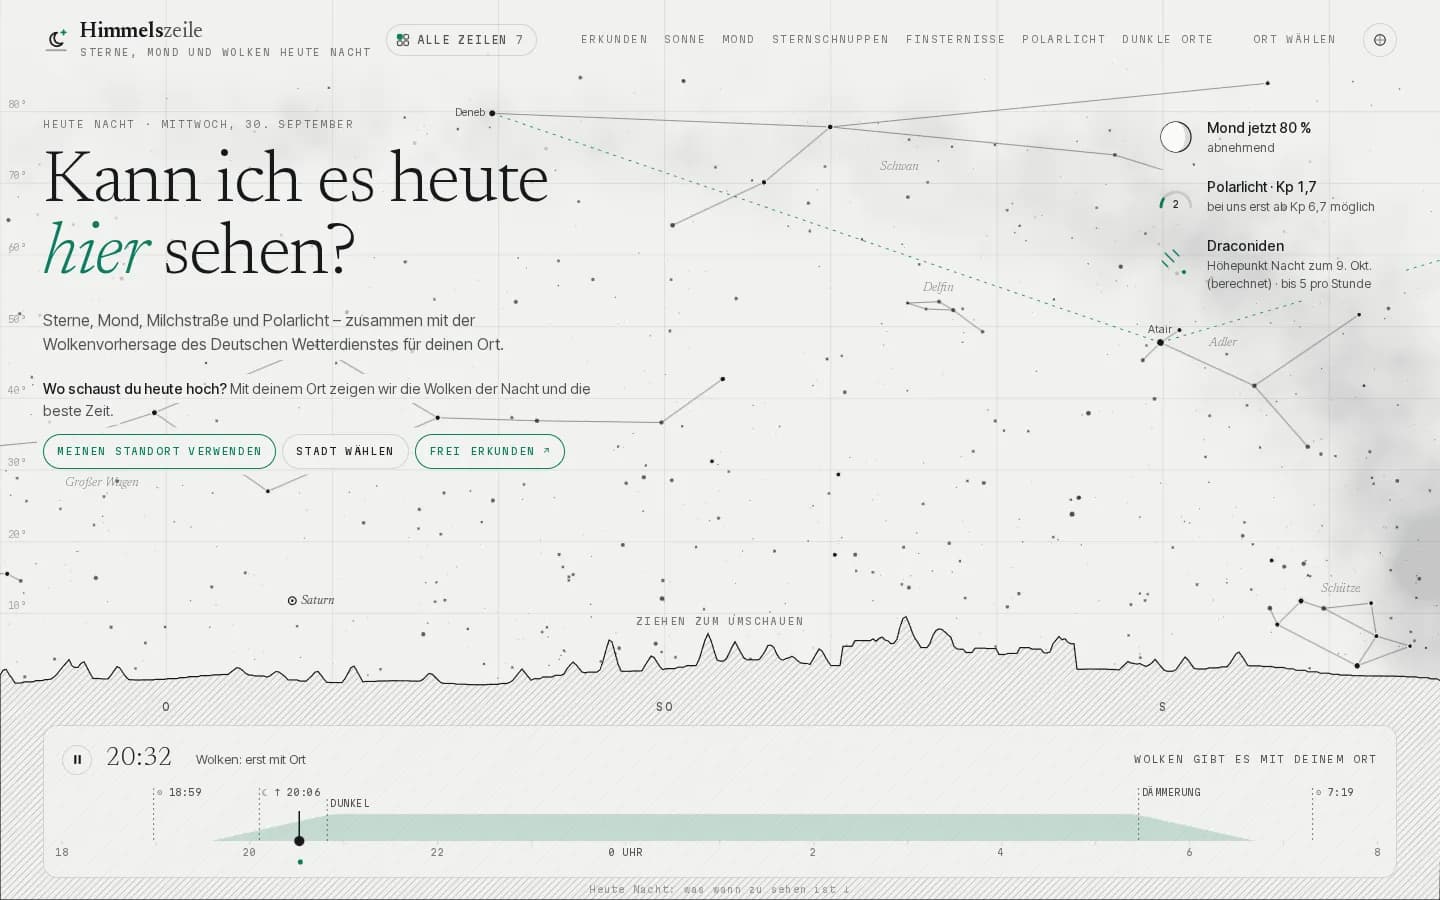
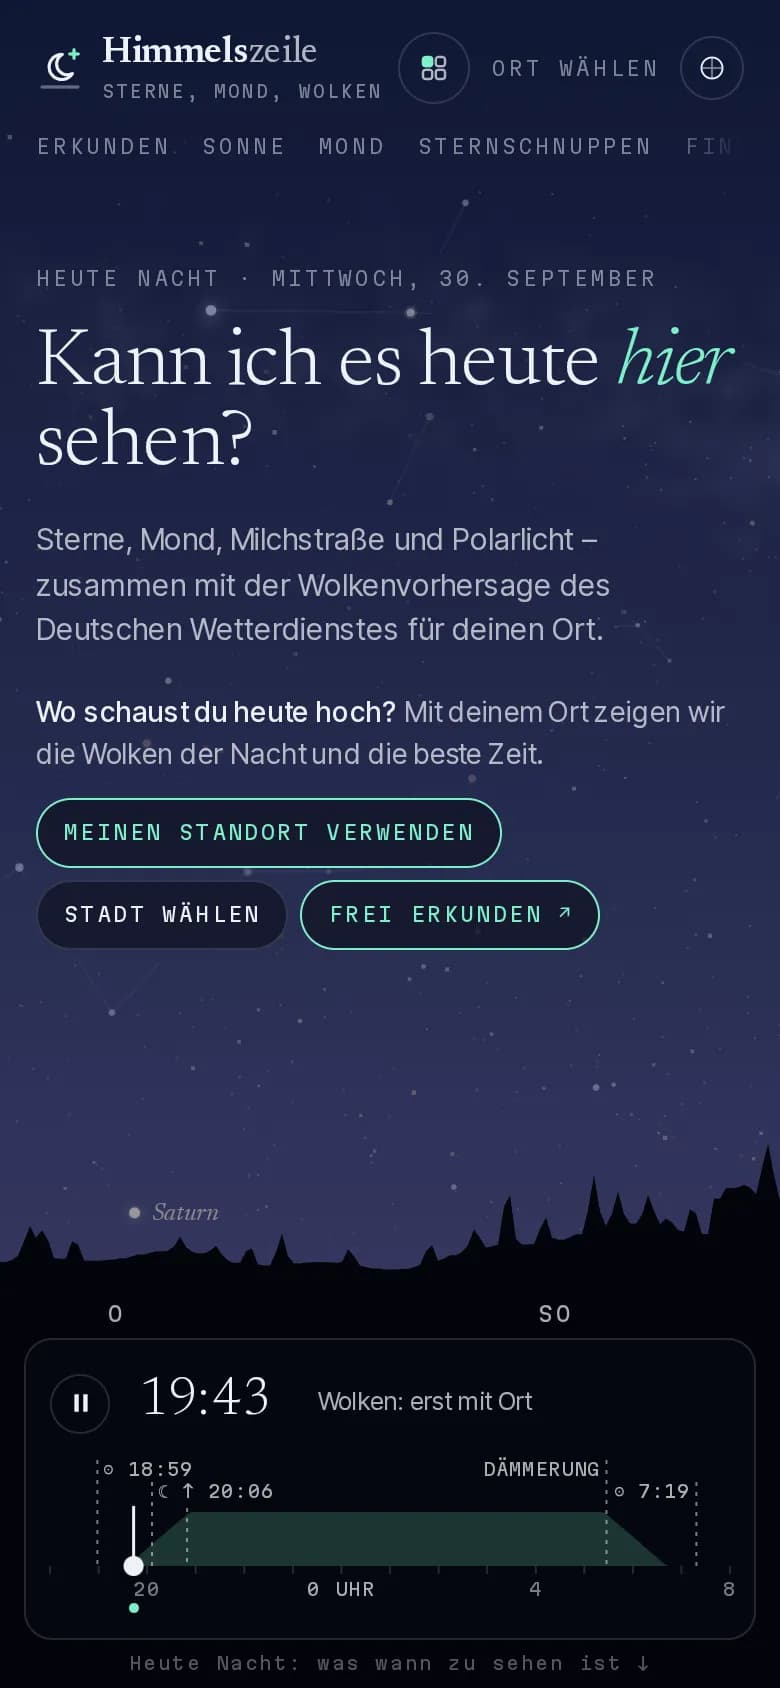
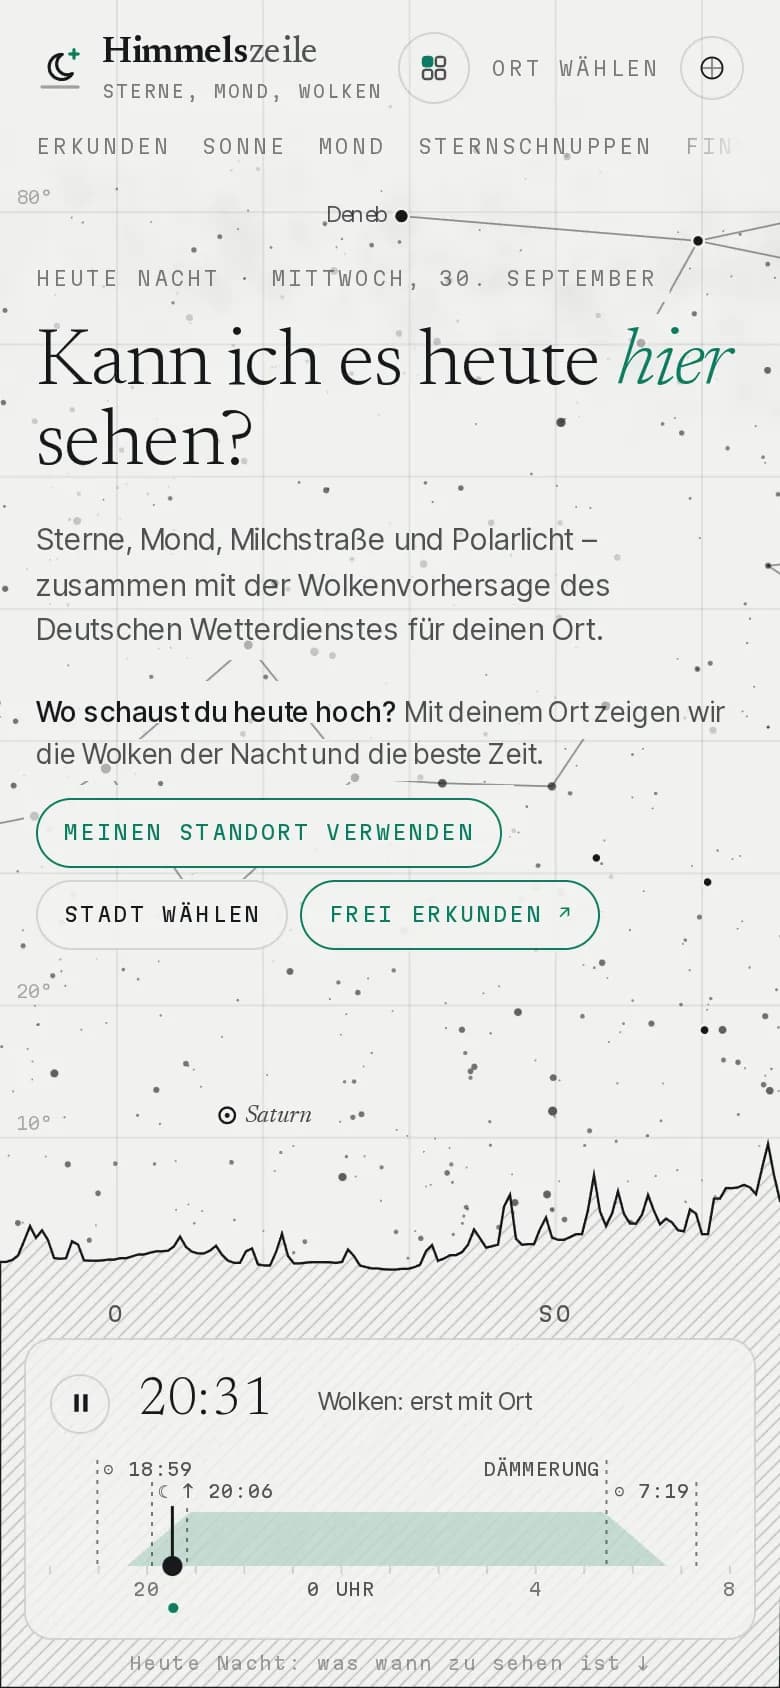
    Stars, moon and clouds tonight for every place in Germany: the sky at your own location to explore, plus the cloud forecast of the German Weather Service. Our own product (in German).

    • Geodata & remote sensing
    • Visualisation

    Own product

  • 16 states · 12 o’clock rule

    Jahreszeile and Tankzeile

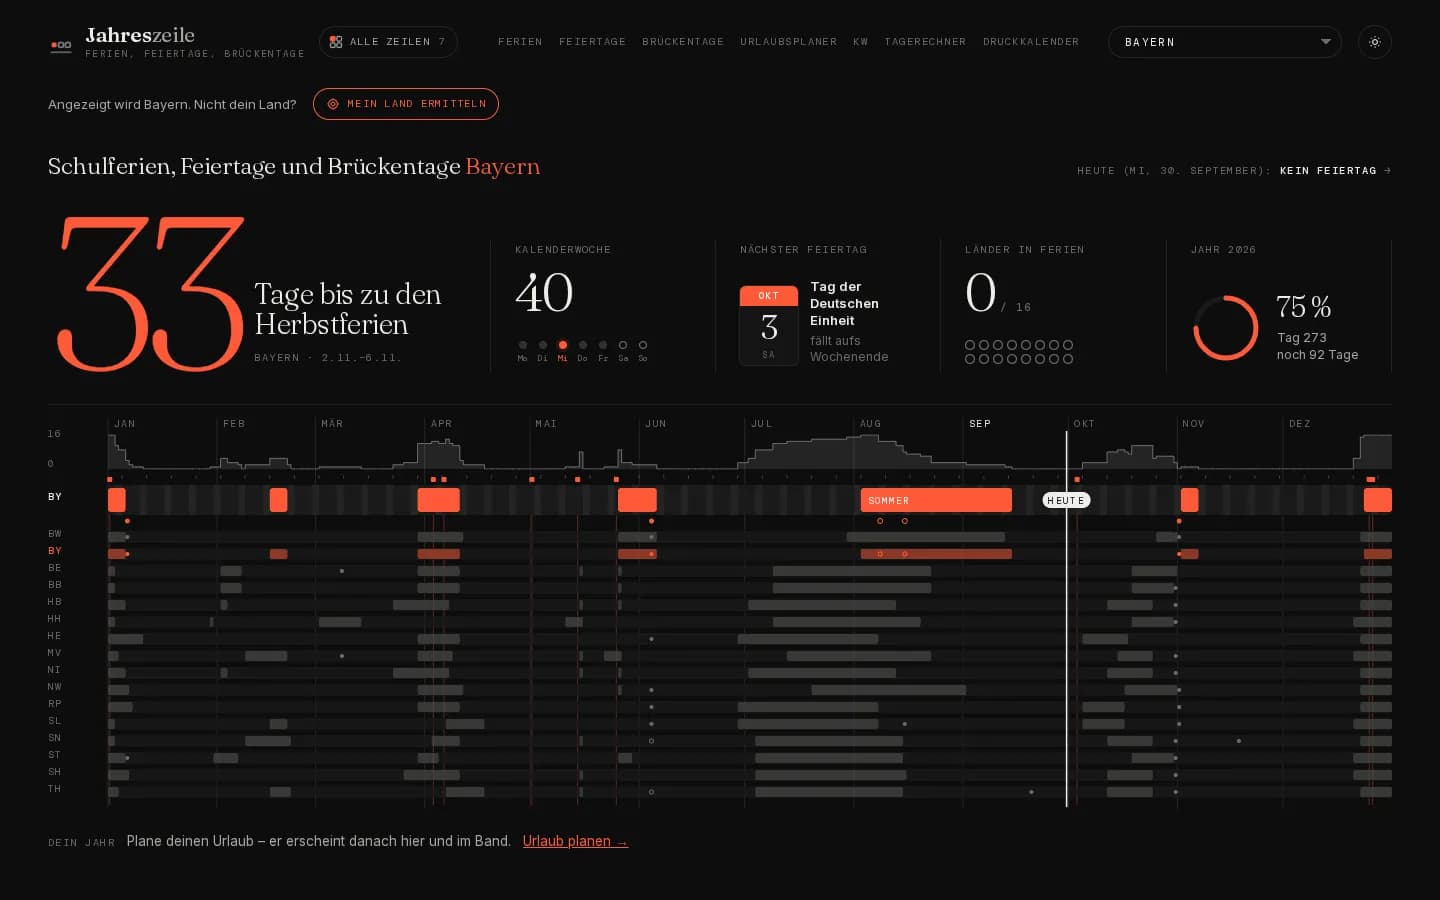
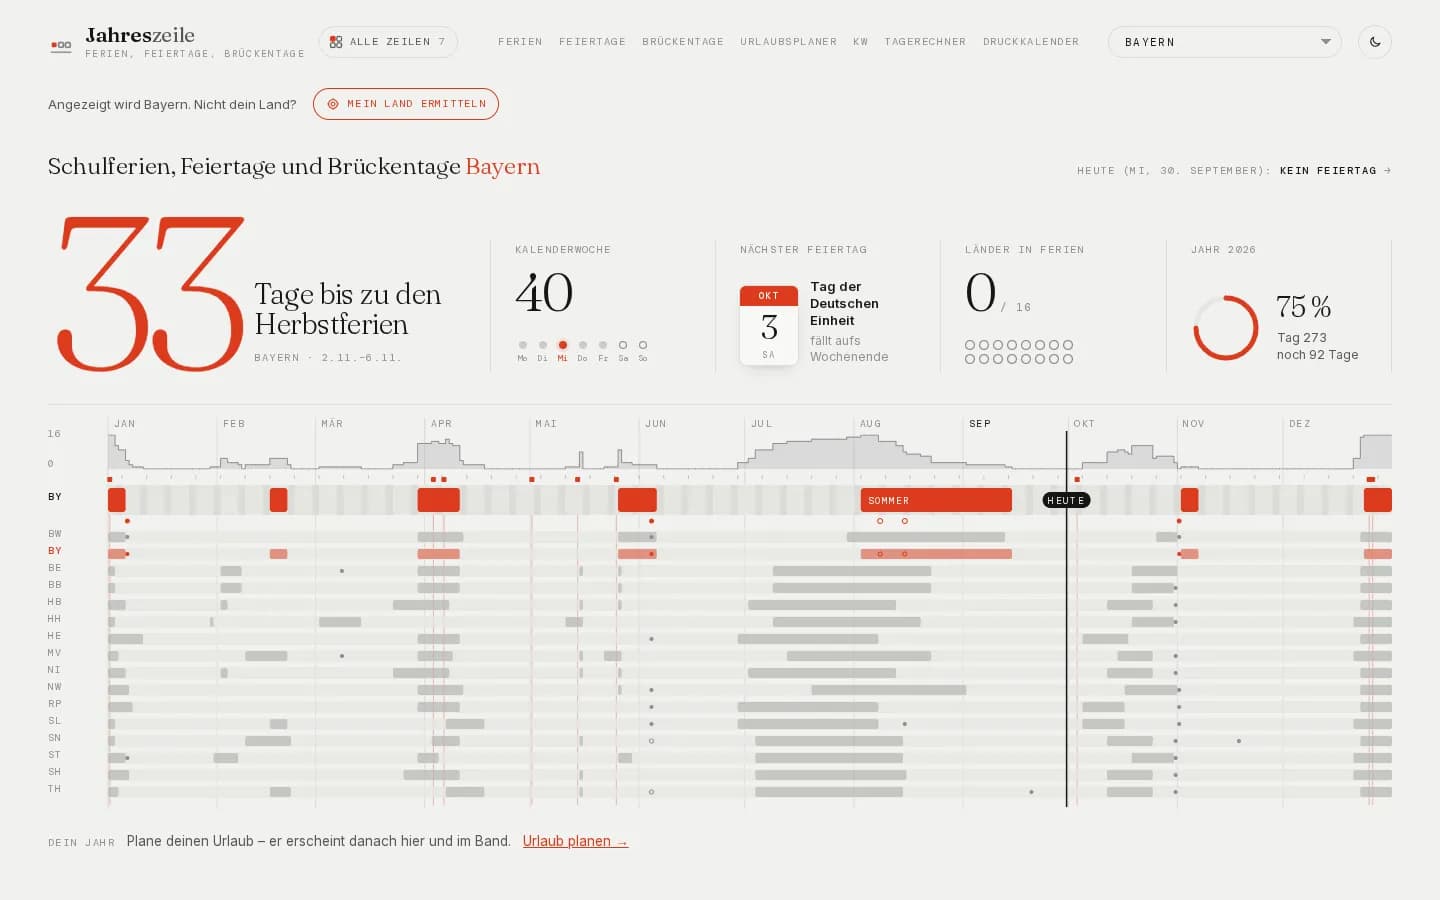
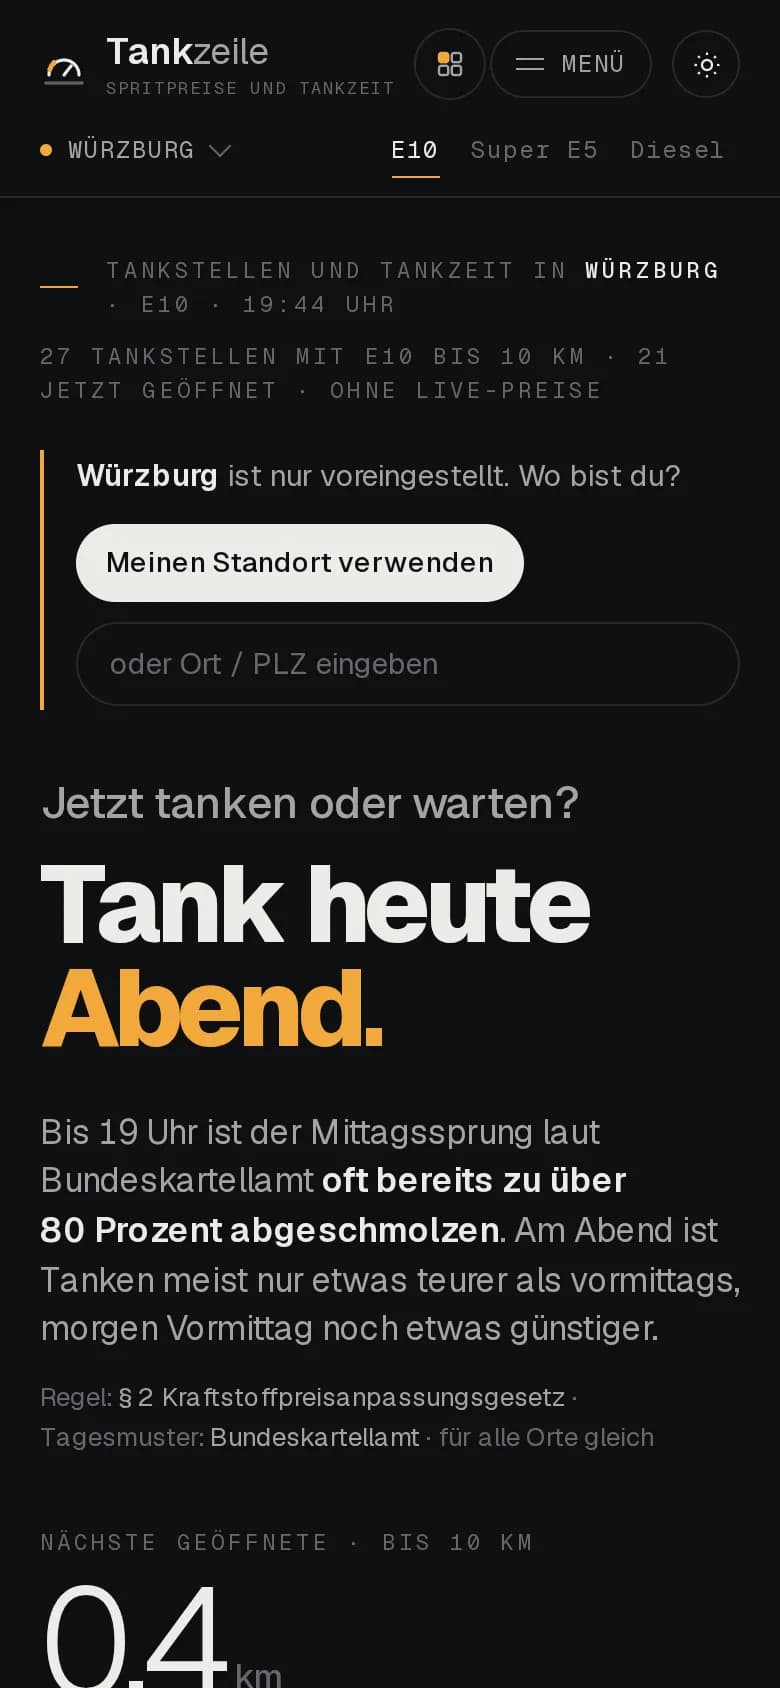
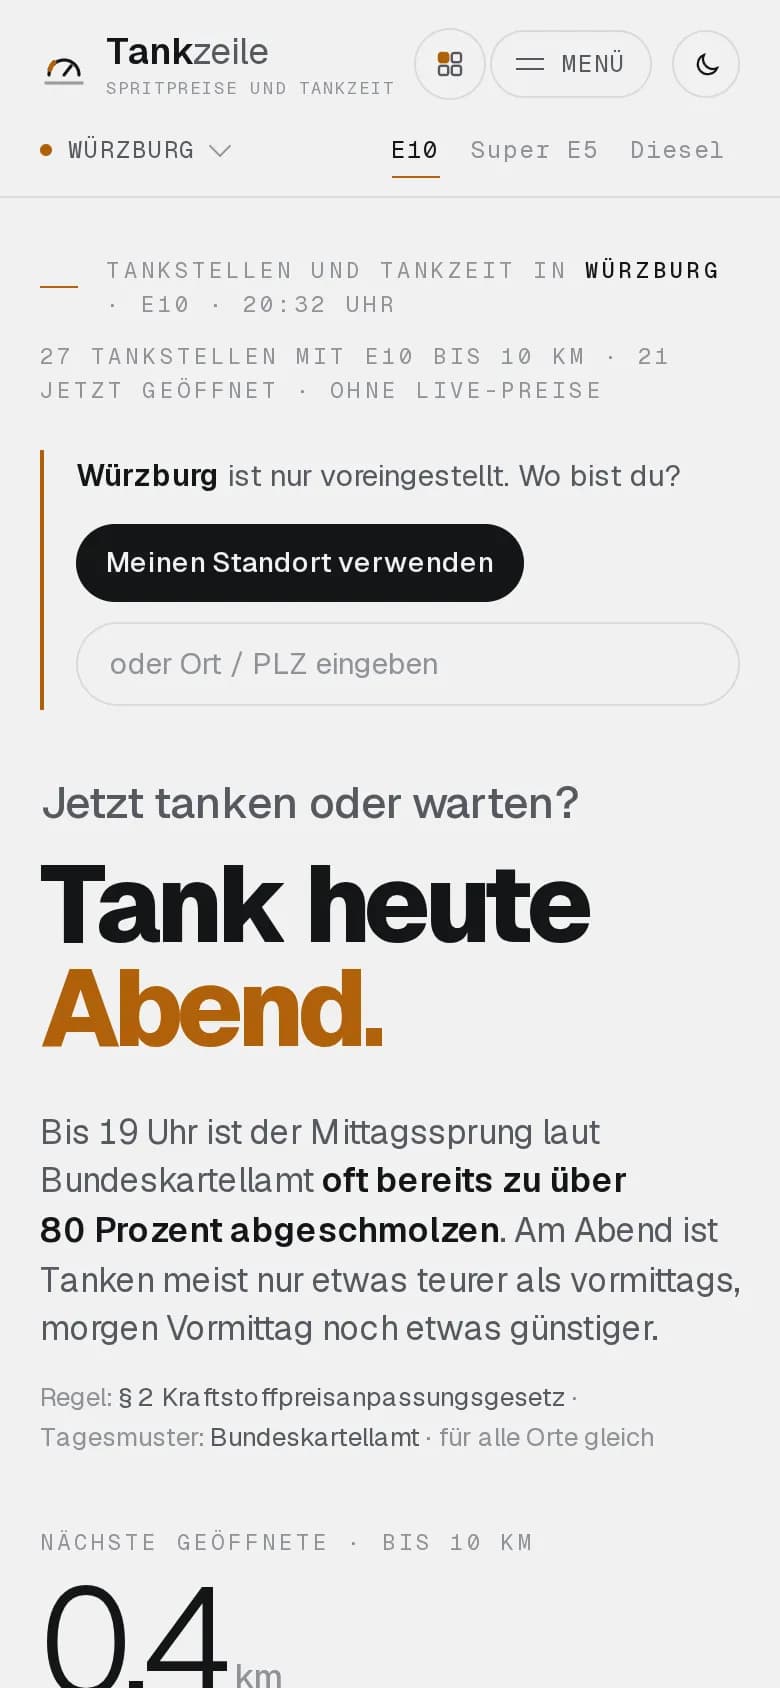
    Time as a line: Jahreszeile puts the school holidays, public holidays and bridge days of all German states into one band, Tankzeile tells you when fuel is cheapest under the 12 o’clock rule. Our own products (in German).

    • Visualisation
    • Web & software

    Own product

  • Scrollytelling · 5 languages

    Mind Atlas

    A map of your own mind: five dimensions of inner perception, told as a scroll story above a living nebula. Our own product.

    • Visualisation
    • Web & software

    Own product

03WebGIS

Maps that answer a question.

A WebGIS does not have to look like specialist software. We combine your geodata with open sources and build a map where people find what they are looking for – on the phone as well as at the desk.

  • Open and official geodata with verified licences (e.g. OpenStreetMap, state survey offices, German Weather Service)
  • Our own routing and distances from a starting point, search by place and postcode
  • Maps without third-party tracking; location only on request and never stored
  • Pages per place or object for search engines, server-rendered
Abb. 02Campingzeile – sites from OpenStreetMap, ranked by weather, driving time, crowding and night

04Process

From the spreadsheet to the answer.

  1. 01 · intro call

    Clarify the question

    Which question should the page answer in three seconds – and for whom?

  2. 02 · a few days

    Review the data

    Sources, licences, freshness, gaps. We say openly what is missing.

  3. 03 · fixed price

    Sketch on real data

    A clickable draft with your data instead of placeholder text – set the direction before building.

  4. 04 · quote

    Build and verify

    Calculations as tested functions, then the interface; phone, light and dark, keyboard.

  5. 05 · optional

    Operation

    Data update themselves; if a source fails, the page stays intact.

05Formats

From a single piece to a data platform.

See pricing
  • Quote

    Interactive graphic

    A chart or map to embed in your page or report, with source and date.

  • Quote

    Scrollytelling story

    A narrative about your data for a report, campaign or anniversary – respecting reduced motion.

  • Quote

    WebGIS / map application

    A map with search, filters, location and pages per place – for municipalities, associations, tourism.

  • Quote

    Data portal

    A page of your own that updates daily from your sources – like our Zeilen.

06Fragen

Frequently asked.

What data can you work with?

Spreadsheets (CSV, Excel), databases, APIs and geodata (GeoJSON, shapefile, GeoTIFF, point clouds). What matters is that we are allowed to use the data – we check the licence with you.

Can we update the graphics ourselves?

Yes. Either they update automatically from your source, or you upload a new spreadsheet. We decide that at the start.

Do we need Google Maps or a GIS subscription?

No. We work with open map data and our own delivery, so there are no per-view licence fees and no visitor data goes to third parties.

Does it work on phones?

Yes, we design for the phone first. We check every page at 390 pixels wide and on desktop, light and dark.

Which data should speak?

Send us a spreadsheet, a link or a question. In the intro call we tell you which form fits – and what it takes.