

Own product · Visualisation · Web & software
Wahllage
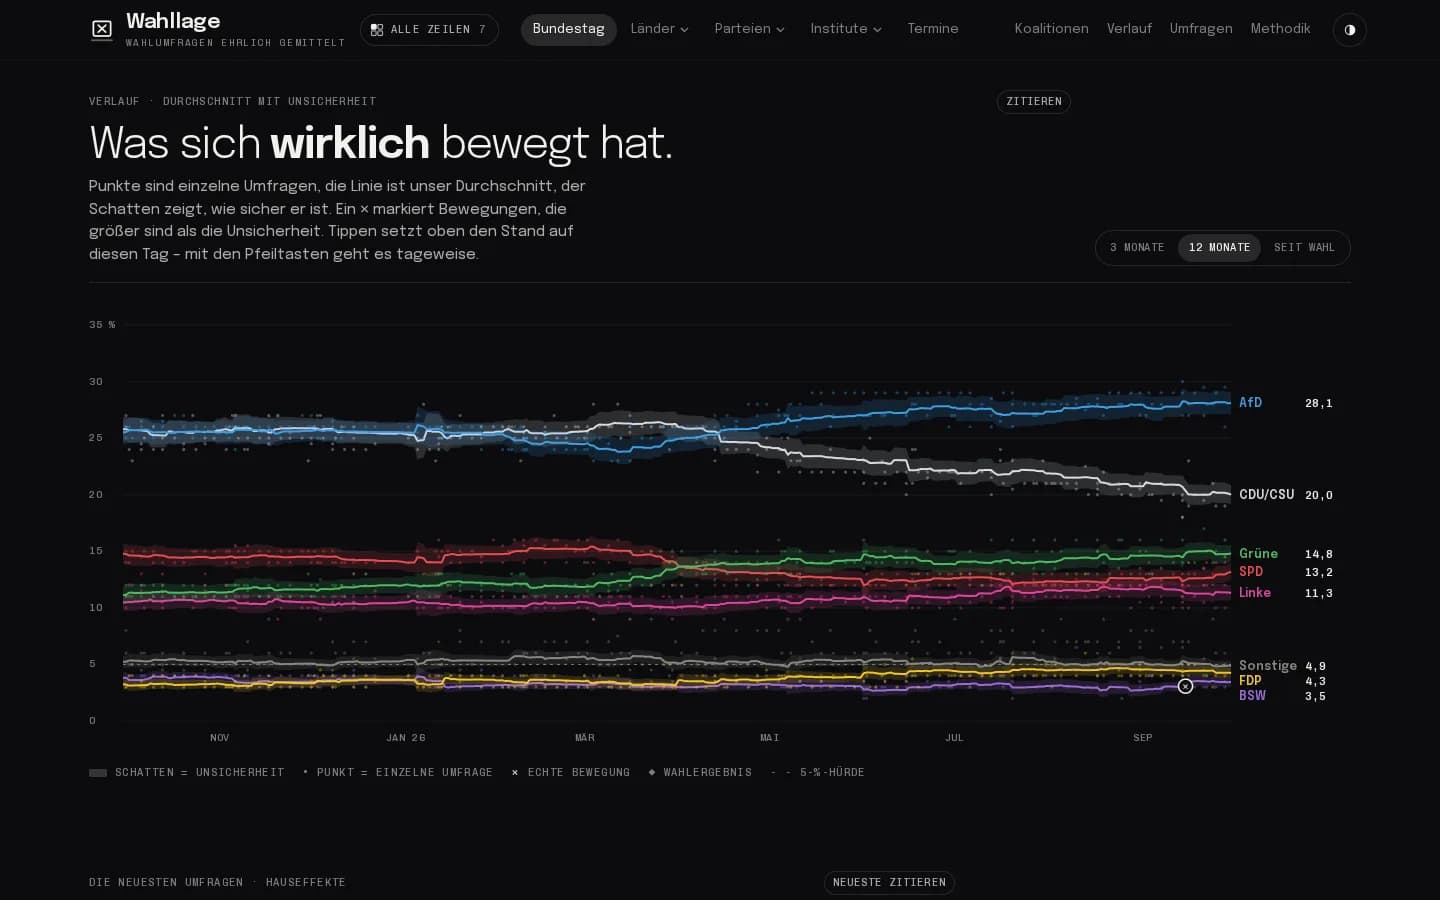
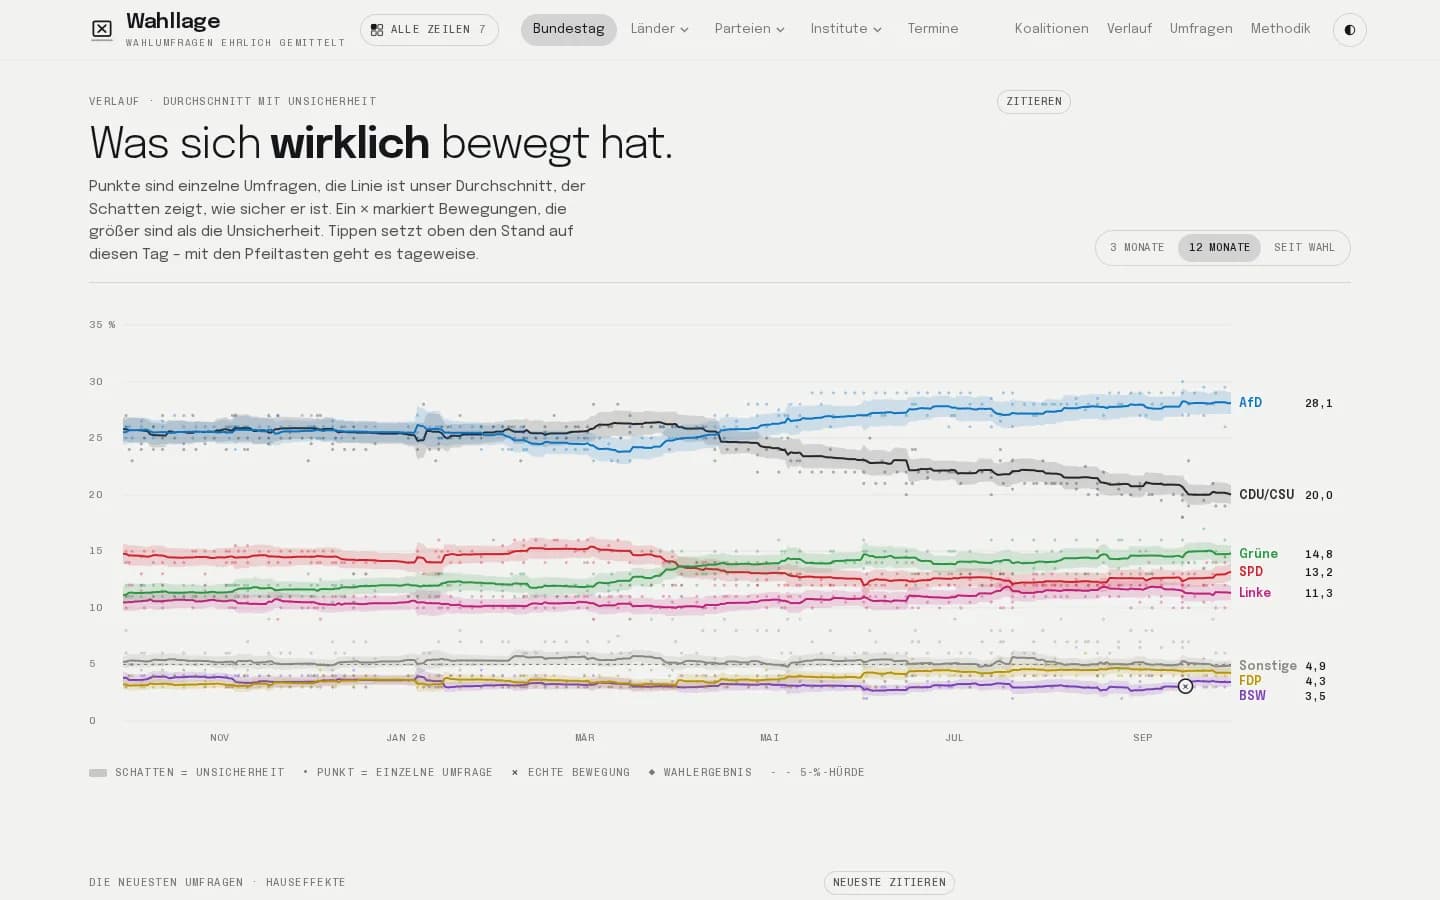
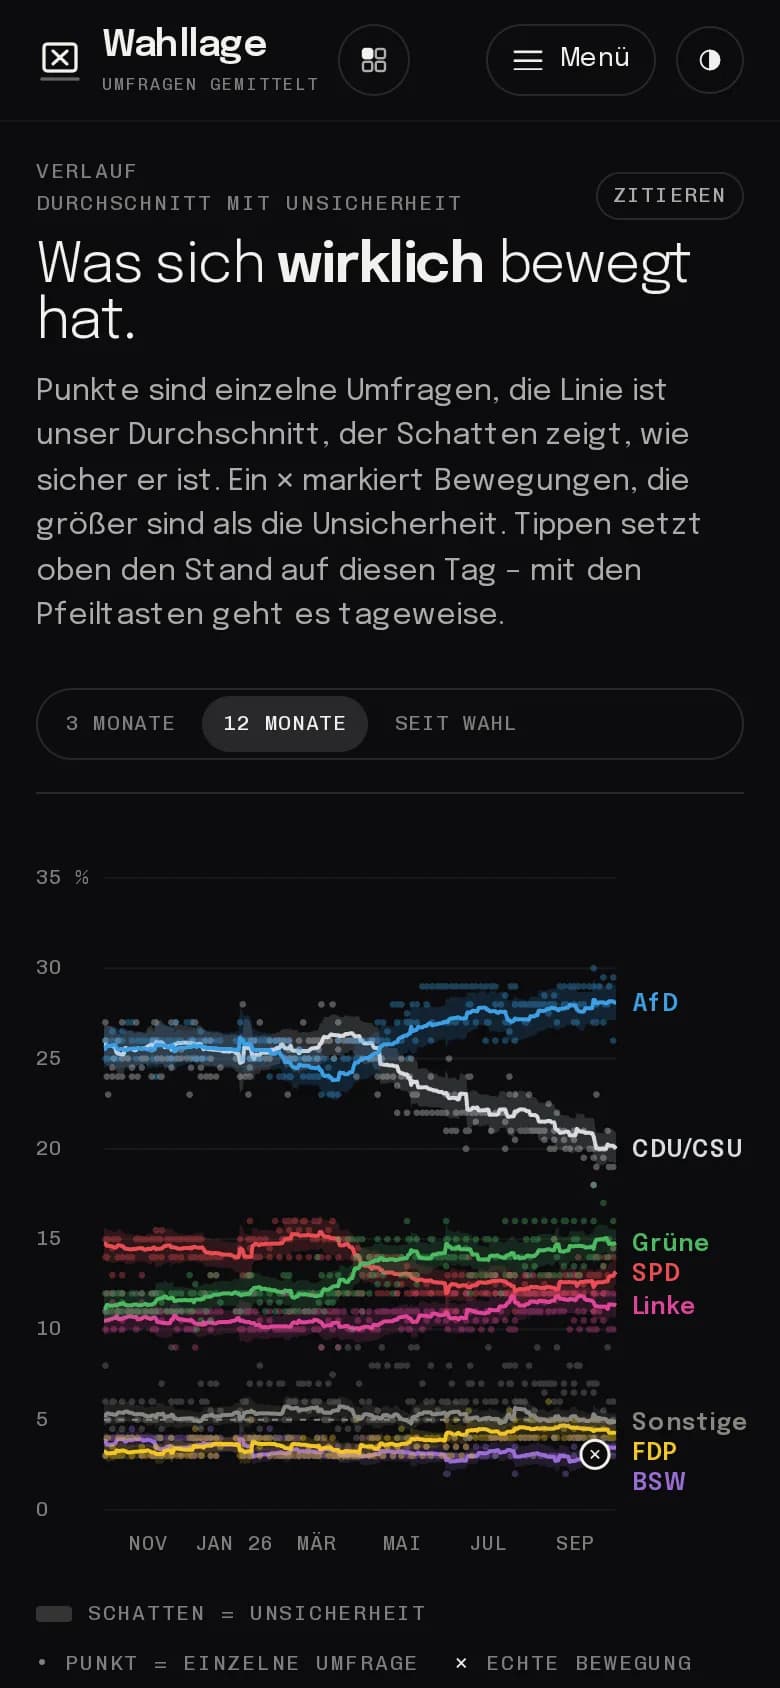
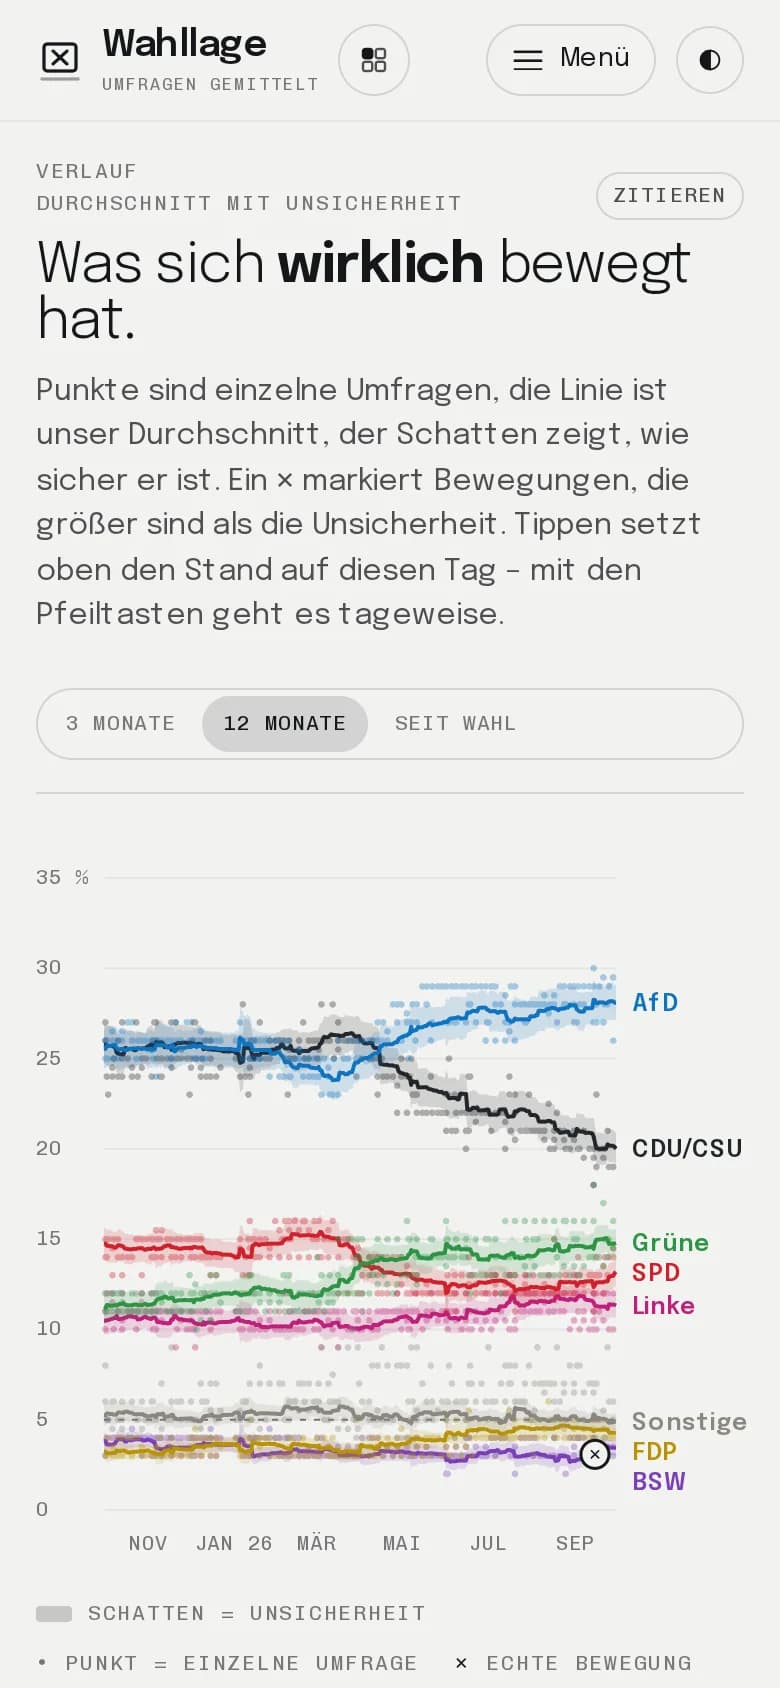
German election polls, honestly averaged: the average with its uncertainty, pollster house effects, seats and majorities – for the Bundestag and all 16 state parliaments. Our own product.
- parliaments: the Bundestag and all 16 state parliaments, seats as published by the returning officers
17
parliaments: the Bundestag and all 16 state parliaments, seats as published by the returning officers
wahllage.de, as of 30 Sep 2026
- our seat calculation reproduces the 2025 Bundestag allocation seat by seat
exact
our seat calculation reproduces the 2025 Bundestag allocation seat by seat
test against the Federal Returning Officer, vol. 3, table 6.1.1
- automated tests in 22 test files check the average, seats, citations and charts
102
automated tests in 22 test files check the average, seats, citations and charts
gate run of 30 Sep 2026
01Starting point
Single polls fluctuate, and headlines like to turn noise into movement. Anyone who wants to know where the parties really stand needs an honest average that shows the uncertainty – and that can be cited with a fixed date.
02Approach
- 01All polls from the open dawum.de database (ODbL), read in daily and condensed into a weighted 30-day average.
- 02Uncertainty shown as a band: the page only flags “real movement” when it is larger than the noise.
- 03House effects calculated per pollster and shown openly – who regularly measures a party higher, who lower?
- 04Seats via Sainte-Laguë with simulations for the chance of entering parliament and for majorities; the method reproduces the 2025 federal election exactly.
- 05Citable: fixed daily snapshots with a link, ready-made citation sentences, BibTeX and APA, charts under CC BY 4.0 and embeds without tracking.
- 06Methodology, track record at past elections and all data as JSON and CSV – the derived database again under ODbL.
03Outcome
Wahllage has been online at wahllage.de since autumn 2026: a page without headlines that still tells you within three seconds where things stand – and why.
- Next.js
- TypeScript
- Statistik-Modell
- SVG-Grafiken
- Vitest
- Open Data (ODbL)
A similar task on your desk?
In the intro call we tell you how we would approach it – and how quickly you would see results.